
Insights
The economics of alert-driven maintenance
13 min read
Most of the money spent maintaining unmanned infrastructure goes on confirming that nothing is wrong. An engineer drives out to a compound, unlocks the gate, checks that the cabin is cool and dry, that the door seals hold, that nothing has grown across the access path, signs a sheet and drives back. Nine visits in ten find a site doing exactly what it was doing the day it was commissioned. The tenth finds a problem that started weeks earlier.
01
What nearly a thousand unmanned sites taught us about the cost of looking
Estate owners run this arrangement not because it works well but because, until recently, there was no practical alternative. An unmanned site cannot tell you it is in trouble. So you visit on a schedule, and you set the schedule by anxiety: the sites that have caused problems get seen weekly or even daily, the quiet ones drift to quarterly, and the schedule as a whole answers a question nobody actually asked, which is "how often can we afford to look?" rather than "which sites need someone today?"
This paper puts numbers on what changes when the sites start reporting for themselves. It draws on operational experience from a live United Kingdom deployment across a critical national infrastructure estate — a three-year programme, approaching a thousand sites, with eighteen months of continuous field data behind it and a telemetry record approaching two billion individual data points. It then builds a cost model from published UK figures, prices the shift at three estate sizes, and closes with a blank version of the model so any estate owner can run their own numbers. Every assumption is stated, sourced where a source exists, and swappable.
02
What an estate looks like when it reports every few minutes
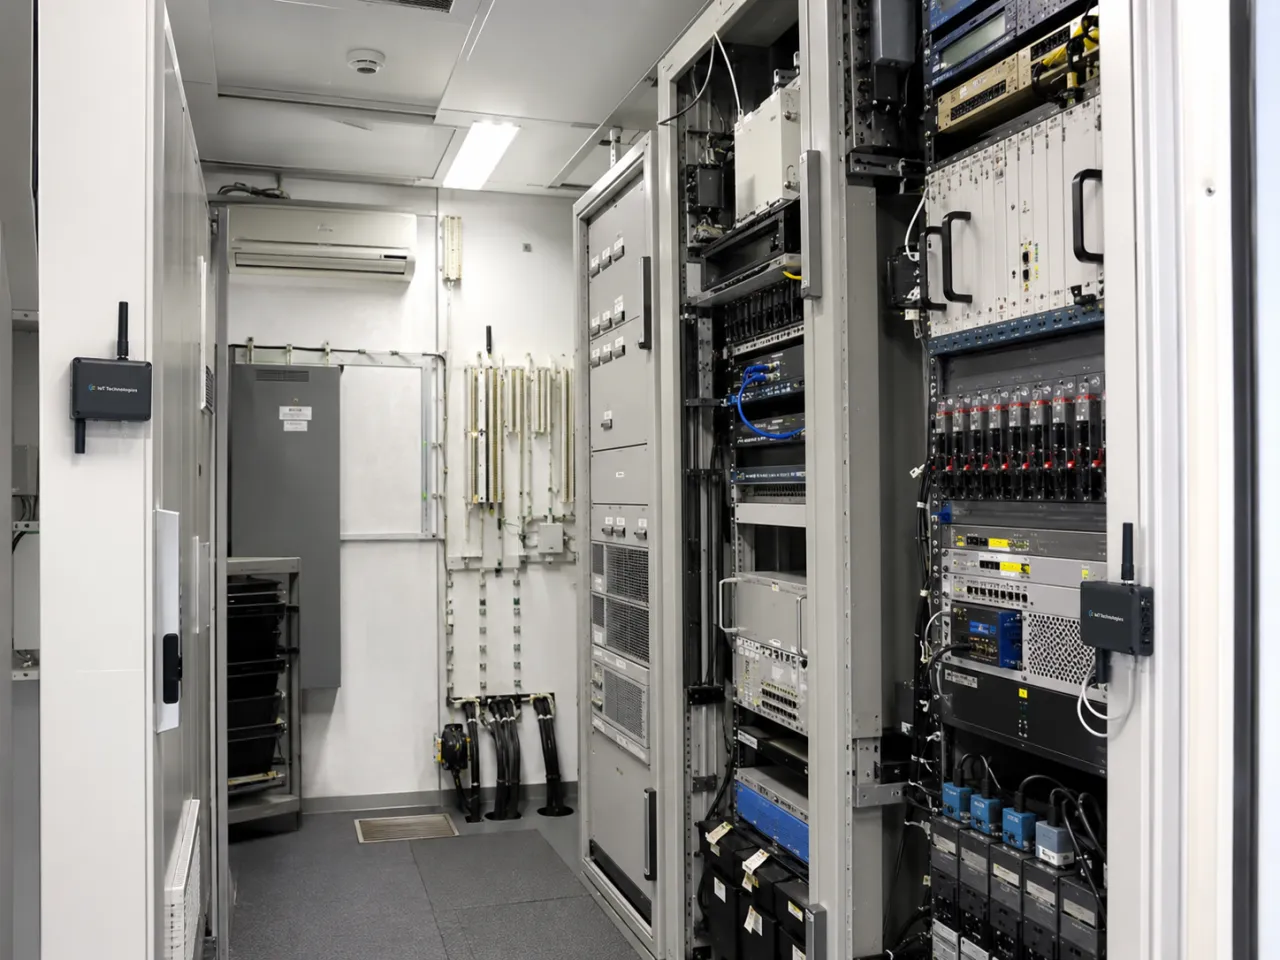
The deployment fits battery-powered sensor tags inside site enclosures and reports continuously over one-way radio telemetry: temperature, humidity, water ingress, power state, equipment state, door state, motion and vandalism. There is no local infrastructure to maintain, and nothing at the site depends on mains power or a wired network to raise its hand. Readings flow to a dashboard; the dashboard turns state changes into alerts; alerts route to the people responsible, with escalation if nobody acknowledges them.
Eighteen months of this, at scale, produces a picture of estate behaviour that no inspection regime can. The findings below are the ones that changed how the estate is run — and, further down, they are what the cost model prices.
03
Heat is the finding that matters most
Across the estate, temperature accounts for the largest share of alerts raised, and in summer it dominates the alert stream entirely. The engineering reason is unglamorous. An equipment cabin is a sealed box full of electronics that generate heat, cooled by ventilation that is usually passive and occasionally broken. When a cooling fan fails, it fails silently — no alarm, no outward sign — and the cabin begins climbing away from its design temperature within hours. Under a scheduled regime that failure runs unobserved until the next visit, and everything inside the cabin spends the interval cooking.
Sustained heat is not a comfort problem; it is a capital problem, and it compounds along two lines.
The first is electronics. A long-standing reliability rule of thumb, inherited from decades of military and telecommunications handbook data, holds that electronic component failure rates roughly double for every 10°C of sustained temperature rise. The rule is crude, and modern equipment varies widely, but its direction has never been overturned: a cabin running hot is a cabin ageing its contents at a multiple of the design rate, and doing it silently.
The second is batteries, and here the numbers are precise enough to plan on. Valve-regulated lead-acid batteries — the standby power in most unmanned sites — are rated for a design life at 20–25°C, and manufacturers' application data documents the same relationship across the industry: sustained operation roughly 8–10°C above rated temperature halves the expected service life. A battery string is £1,500–£4,000 per site depending on capacity. An estate whose cabins spend their summers hot is silently converting battery capital into replacement schedule, and it shows up years later as "batteries just don't seem to last" rather than as the thermal problem it always was.
Live temperature telemetry changes the operating posture in a way a monthly reading on a clipboard never could. The estate effectively ranks itself: the hottest sites surface at the top of the dashboard each afternoon, and engineers go where the readings send them rather than where the rota does. A ventilation failure becomes a same-day dispatch instead of a discovery weeks later. And after a full summer of data, the estate owner holds something genuinely new — an honest thermal history of every enclosure, which is the missing input for every battery-replacement and ventilation-upgrade decision they have been making blind.
04
The rest of the alert stream
Temperature leads, but four other categories carry real money, and each rewards the same shift from discovery to notification.
Water ingress. Water enters unmanned enclosures through failed door seals, degraded cable duct glands and roof penetrations, and it almost always enters during weather — which is precisely when nobody is visiting. Undetected, it sits: corrosion works from the floor up, terminations and earth bonds degrade, and by the time a scheduled visit finds the tide mark the damage is done. An ingress tag timestamps the onset, which does two things. It turns the event into a dispatch while the water is still a puddle rather than a loss, and — correlated against weather records across many events — it identifies which sites leak in which conditions, converting an emergency category into a seal-and-gland maintenance list.
Power state. An unmanned site rides out grid interruptions on its batteries, and without telemetry the operator learns about an outage in one of two ways: when the service the site carries goes down, or never. Power-state telemetry timestamps the moment mains is lost, at which point battery autonomy — typically four to eight hours for a standby-powered site — stops being a specification and becomes a countdown visible on a dashboard. The dispatch decision is made with the clock in view. Just as usefully, the pattern of events tells its own story: a site logging repeated brief interruptions has a supply-side or connection problem worth raising with the network operator before it becomes a hard failure, and no scheduled visit would ever have seen it.
Humidity. Damp is the slow sibling of ingress. Condensation cycles — warm days, cold nights, moisture-laden air crossing its dew point on cold metalwork — corrode equipment without a drop of standing water ever appearing. Humidity is a trend signal rather than a spike: what the telemetry surfaces is the enclosure whose baseline is drifting upward, which is a ventilation or sealing defect announcing itself months before it becomes a fault.
Motion and vandalism. Infrastructure compounds attract repeat attention: a site that has been interfered with once is disproportionately likely to be visited again, and metal theft from infrastructure sites remains a persistent and well-documented UK problem. Motion and vandalism telemetry does not physically stop anyone, and this paper will not pretend otherwise. What it does is replace "discovered damaged at the next visit, date of incident unknown" with a timestamped record — motion events at unsociable hours, the sequence and timing of interference — which changes the quality of every downstream conversation: with responders, with insurers, and with whoever decides which sites justify hardening spend.
05
The door is a ledger nobody was keeping
A door-contact tag reports a simple fact — the door opened at this time and closed at that time — and on its own that is a security signal. Correlated against the attendance a site operator expects, it becomes something more useful.
Most estates run an authorisation process through which contractors and staff declare site attendance in advance: a sign-on platform, a permit system, a control-room call. Most estates also discover, once door telemetry arrives, how often that process is skipped. People attend unannounced. The work may be entirely legitimate — but the operator's picture of who is on their infrastructure, and when, has a hole in it exactly as wide as the gap between the door record and the attendance record.
The telemetry closes that hole without surveilling anyone. The tag does not identify who came, does not judge why, and makes no claim about what they wore or carried; it reports a state change, and the reconciliation does the rest. In eighteen months of estate-scale operation, that reconciliation has proved to be one of the most quietly valuable outputs of the whole system: it gives process owners the evidence to tighten sign-on discipline, and it means an open door at 03:00 on an unmanned site is a live alert rather than a mystery in a future incident report.
There is a thermal footnote here too, and it is bigger than it sounds: a door is a hole in an enclosure's climate as well as its security. Door-open duration — derived from the open and close timestamps — regularly explains temperature excursions that would otherwise read as equipment faults. One signal, two findings.
06
The model: what scheduled inspection costs, and what alert-driven dispatch costs instead
The model below describes a representative estate of one thousand unmanned sites. It is illustrative, not a client's accounts: the deployment figures above establish that the operating pattern is real at this scale, and the model prices that pattern using published UK cost data and stated assumptions.
Assumptions
| Input | Value | Basis |
|---|---|---|
| Estate size | 1,000 sites | Representative; matches the scale of the live deployment |
| Inspection regime before | 1 visit per site per month average | Mixed regimes are normal — some sites seen daily, some rarely; monthly is taken as the fleet average |
| Round trip per visit | 40 miles | Assumed UK average across a dispersed estate |
| Time per visit, door to door | 2.5 hours | Travel plus a routine inspection |
| Fully loaded cost per visit | £150–£200 | Derivation below |
| Regime after | 1 planned visit per site per year, plus alert-driven dispatch averaging 2 visits per site per year | Planned attendance retained; exceptions dispatched as raised |
| Vehicle | Diesel van, 35 mpg assumed | For the carbon calculation |
| Monitoring cost | £10 per site per month assumed | Stated for the return calculation; substitute your own quoted figure |
The per-visit cost deserves its derivation, because it is the number everything else stands on. The UK median salary for a field service engineer is £35,000 (ITJobsWatch, six months to January 2026). Once employer costs, vehicle, absence and overhead are loaded, UK field-service costing guidance puts the true rate at £55–£60 per hour (Fieldmotion, 2026). At 2.5 hours door to door, labour alone is roughly £140–£150, before fuel, vehicle wear and the scheduling overhead that sits behind every dispatch. International analyses of dispatch economics, including figures attributed to the Technology & Services Industry Association, place a fully loaded site visit at $150–$500, with some estimates near $1,000 once every indirect cost is counted. Against that background, £150–£200 per UK visit is conservative.
Results
A monthly regime across a thousand sites is 12,000 visits a year. The alert-driven regime — one planned visit per site plus an average of two exception dispatches — is 3,000. The difference is 9,000 visits a year that no longer happen, a 75% reduction, and it prices as follows.
| Line | Annual value |
|---|---|
| Visits avoided | 9,000 |
| Direct cost avoided at £150–£200 per visit | £1.35m – £1.8m |
| Engineer hours released at 2.5 hours per visit | 22,500 hours — roughly the annual capacity of 13 engineers |
| Road miles avoided at 40 miles per visit | 360,000 miles |
| Diesel not burned at 35 mpg | ~47,000 litres |
| Carbon not emitted at 2.57 kgCO₂e per litre (UK Government GHG Conversion Factors, 2026) | ~120 tonnes CO₂e |
At the assumed monitoring cost of £10 per site per month, the system costs £120,000 a year to run across the estate. Against the midpoint of the visit saving alone, the modelled saving accrued in the first five weeks of the year covers the monitoring cost for all twelve months.
07
Two lines most owners underprice
Early intervention against silent failure. The cost difference between a planned repair and an emergency one is not marginal. A cooling failure caught the day it happens is one planned dispatch and a fan. The same failure discovered at the next scheduled visit is an out-of-hours callout, secondary damage to whatever the heat reached, and often a repeat visit for parts — and the site may already have failed in service. The model assumes conservatively that 2% of sites a year suffer a silent failure that would otherwise escalate between visits, and that early intervention converts a £5,000 emergency into a £1,000 planned repair. On a thousand sites that is a further £80,000 a year, and the 2% incidence is the input most owners revise upward once they see their own alert data.
Battery life, priced. Take the thermal relationship from earlier and put money on it. Assume a battery string worth £2,750 per site, and an estate whose thermal history has been forcing replacement at four years against a seven-year achievable life. The annualised replacement cost falls from about £690 to about £390 per site — roughly £295,000 a year across the thousand sites. Continuous temperature telemetry does not cool a cabin by itself, but it identifies which sites run hot, gets ventilation failures fixed in hours instead of months, and gives the estate its first honest picture of the conditions its batteries actually live in. Even capturing half the modelled benefit is a six-figure line.
Summed, the modelled annual value on a thousand-site estate is in the region of £1.7m–£2.2m against a modelled monitoring cost of £120,000 — before assigning any value to the outages that early intervention prevents, which for infrastructure carrying service-level commitments is frequently the largest number of all, and the one only the estate owner can price.
08
The same model at three estate sizes
The economics scale close to linearly with site count, so the per-site figures carry: each site under the model contributes roughly £1,575 a year in avoided visit cost at the midpoint, plus about £80 in emergency conversion and up to £295 in battery life. The table below runs the full model at three estate sizes. One caveat travels with it: very large estates often achieve shorter average travel legs through engineer density, which pulls the per-visit cost down and the visit volumes up — the two effects partially offset, and the linear model remains a fair planning basis.
| 250 sites | 1,000 sites | 5,000 sites | |
|---|---|---|---|
| Visits avoided per year | 2,250 | 9,000 | 45,000 |
| Visit cost avoided | £340k – £450k | £1.35m – £1.8m | £6.75m – £9.0m |
| Engineer hours released | 5,600 (≈3 engineers) | 22,500 (≈13) | 112,500 (≈65) |
| Road miles avoided | 90,000 | 360,000 | 1.8m |
| CO₂e avoided | ~30 tonnes | ~120 tonnes | ~600 tonnes |
| Emergency conversion line | £20k | £80k | £400k |
| Battery life line | £74k | £295k | £1.48m |
| Modelled annual value | £430k – £545k | £1.73m – £2.18m | £8.6m – £10.9m |
| Modelled monitoring cost | £30k | £120k | £600k |
| Return on monitoring spend | ≈ 14–18× | ≈ 14–18× | ≈ 14–18× |
The ratio holding steady across scales is the point worth sitting with. This is not an economy that only works for giants; a 250-site estate is avoiding six visits a day it did not need to make.
09
The carbon line stands on its own
The carbon figures above are not a gesture. They are calculated on the UK Government's greenhouse gas conversion factors — the DESNZ and Defra dataset published in June 2026 that underpins Streamlined Energy and Carbon Reporting — and fleet mileage is Scope 1, which means a visit-substitution programme of this shape produces a reportable, auditable reduction in an estate operator's own emissions rather than an offset or a claim. For operators carrying published net-zero commitments, 360,000 road miles a year that no longer need driving is one of the few decarbonisation lines that arrives with a seven-figure cost saving attached rather than a cost. At the five-thousand-site scale the avoided emissions approach 600 tonnes of CO₂e a year — the annual footprint of a small business, removed from a maintenance budget as a side effect of running it better.
10
Two billion data points, and what they make possible
There is a second asset accumulating alongside the savings, and it may prove the more valuable one. Eighteen months of continuous multi-sensor telemetry across nearly a thousand sites is a dataset approaching two billion individual readings: every site's thermal profile through two summers, its humidity cycles, its door activity, its power events, all timestamped and comparable across the estate.
A corpus of that size changes what analysis can honestly be attempted. Site-level anomaly prediction — identifying which sites will run hot before they do, from the shape of their own history and the behaviour of sites like them — becomes tractable rather than speculative, and it is precisely the class of problem that modern machine-learning methods are suited to. The claims here should stay measured, because in this field they usually are not: no model predicts a fan bearing's last day. What a dataset like this supports is a ranked view of emerging risk, learned from the estate's own behaviour, so that the planned visit goes to the site that is drifting rather than the site whose turn it is. Scheduled inspection asked every site the same question on the same day. The data asks each site its own question, continuously — and after two billion answers, patterns emerge that no inspection sheet ever held.
11
What deployment actually involves
The word "programme" overstates it, and that is worth saying plainly, because estate owners routinely assume this class of visibility requires site works, mains power, network connections and a season of disruption. It requires none of them.
Survey. Start with a representative slice of the estate — the troublesome sites and the quiet ones both, because the quiet ones are where silent failure hides. The survey establishes what matters at each site: which enclosures, which doors, where water would arrive first, what the local thermal risk looks like.
Fit. The tags are battery-powered and self-contained, with a five-year design life on the battery. Fitting a site is measured in minutes, not days: no wiring, no mains connection, no dependency on any network at the site, and nothing about the site's own equipment is touched. An estate rollout is limited by driving between sites, not by work at them — and each fitting visit is the last routine visit that site needs.
Configure. Alert bands, routing and escalation are set per site: who is told, in what order, by dashboard, email or SMS, and what happens when nobody acknowledges. Tag health — battery state, signal quality, expected check-ins — is monitored alongside the readings, so a silent sensor is itself an exception rather than a blind spot.
Prove. Run the telemetry alongside the existing inspection regime for one season, changing nothing. Then put the visit log next to the alert log and count: how many visits found anything the telemetry had not already reported, and how many events the telemetry caught that no visit would have. That comparison, on the estate's own data, is the business case — and in our experience it is the moment the conversation stops being about whether and starts being about how fast.
12
Run the model on your own estate
The correct response to a model is to run it with your own numbers. The table below is the blank version; the worked example alongside is the thousand-site model from this paper.
| Input | Yours | Worked example |
|---|---|---|
| A — sites in the estate | 1,000 | |
| B — inspection visits per site per year today | 12 | |
| C — fully loaded cost per visit | £175 | |
| D — average round trip, miles | 40 | |
| E — planned visits per site per year, after | 1 | |
| F — expected exception dispatches per site per year | 2 |
Then four lines of arithmetic:
1. Baseline inspection cost = A × B × C. (1,000 × 12 × £175 = £2.1m)
2. Alert-driven cost = A × (E + F) × C. (1,000 × 3 × £175 = £525k)
3. Annual visit saving = line 1 − line 2. (£1.575m)
4. Road miles avoided = A × (B − E − F) × D; litres = miles ÷ mpg × 4.546; CO₂e = litres × 2.57 kg. (360,000 miles; ≈47,000 litres; ≈120 tonnes)
Add the battery and emergency lines if they apply to your estate, set the result against a quoted monitoring cost, and the case is yours rather than ours. If the visit count surprises you, you are in good company: it is usually higher than anyone believed, and the exception rate lower.
Methodology note. Operational findings in this paper are drawn from anonymised, aggregated telemetry across a live multi-year UK deployment on a critical national infrastructure estate; no client data, site information or commercial terms are disclosed. The cost model is illustrative: all inputs are stated assumptions, sourced where indicated — UK field service salary data from ITJobsWatch (January 2026); loaded labour rates from UK field-service costing guidance (Fieldmotion, 2026); dispatch cost ranges from published industry analyses citing Technology & Services Industry Association estimates; emissions factors from the UK Government GHG Conversion Factors for company reporting (DESNZ/Defra, June 2026); battery service-life relationships from VRLA manufacturers' published application data; electronics reliability rule of thumb from long-standing military and telecommunications handbook tradition. Substitute your own values where your estate differs.
FAQ
Frequently asked questions
What is alert-driven maintenance?
Alert-driven maintenance replaces scheduled site inspections with continuous remote telemetry: sensors report each site's condition in real time, and engineers are dispatched when a site raises an exception rather than on a fixed rota. Routine visits fall sharply because most scheduled inspections only confirm that nothing has changed.
How much does scheduled inspection of unmanned sites cost?
A fully loaded UK site visit typically costs £150–£200 once engineer time at £55–£60 per hour, travel and vehicle costs are counted. An estate of 1,000 sites inspected monthly spends £1.8m–£2.4m a year on inspection alone, most of it confirming normal operation.
How quickly does remote monitoring pay for itself?
In the model presented here, a 1,000-site estate saves £1.35m–£1.8m a year in avoided visits against an assumed monitoring cost of £120,000 — the saving accrued in the first five weeks of the year covers the monitoring cost for all twelve months, before battery-life and early-intervention benefits are counted.
How much CO₂ does replacing site inspections with remote monitoring save?
Avoiding 9,000 visits a year at a 40-mile average round trip removes 360,000 road miles — roughly 47,000 litres of diesel and about 120 tonnes of CO₂e annually, calculated on the UK Government's 2026 greenhouse gas conversion factors, and reportable as a Scope 1 reduction.
Why is temperature the most important thing to monitor at an unmanned site?
Across a large live UK estate, temperature raises more alerts than any other category, dominating in summer. Heat shortens equipment life quietly: VRLA battery service life roughly halves for sustained operation 8–10°C above rated temperature, and a failed cooling fan can take an enclosure far outside its design conditions within hours with no outward sign.
What sensors does an unmanned site actually need?
The core set proven at estate scale covers temperature, humidity, water ingress, power state, equipment state, door state, motion and vandalism — battery-powered tags with a five-year design life, fitted in minutes with no wiring, no mains and no dependency on any network at the site.